

What is any given company worth? That is a simple question with no definitive answer and no definitive method for answering. The best anyone can say is “it depends”.
It depends on whether the revenues of the company are growing or shrinking.
It depends on whether the profits are growing or shrinking, and whether the profit margins are growing or shrinking.
It depends on whether investors are feeling bullish or bearish. Which leads to times when the market generally has high-valuations or low-valuations.
Finally, it depends on whether we are asking about a young startup, a 50 year-old established company, or a 100+ year old blue chip.
It depends on the state of the economy as a whole.
Where “market” and “economy” includes the country/region where the company is based and where the customers are based as well as the business sector of the company.
That is the theory. Let’s look at an example. One that we likely all know, Apple.
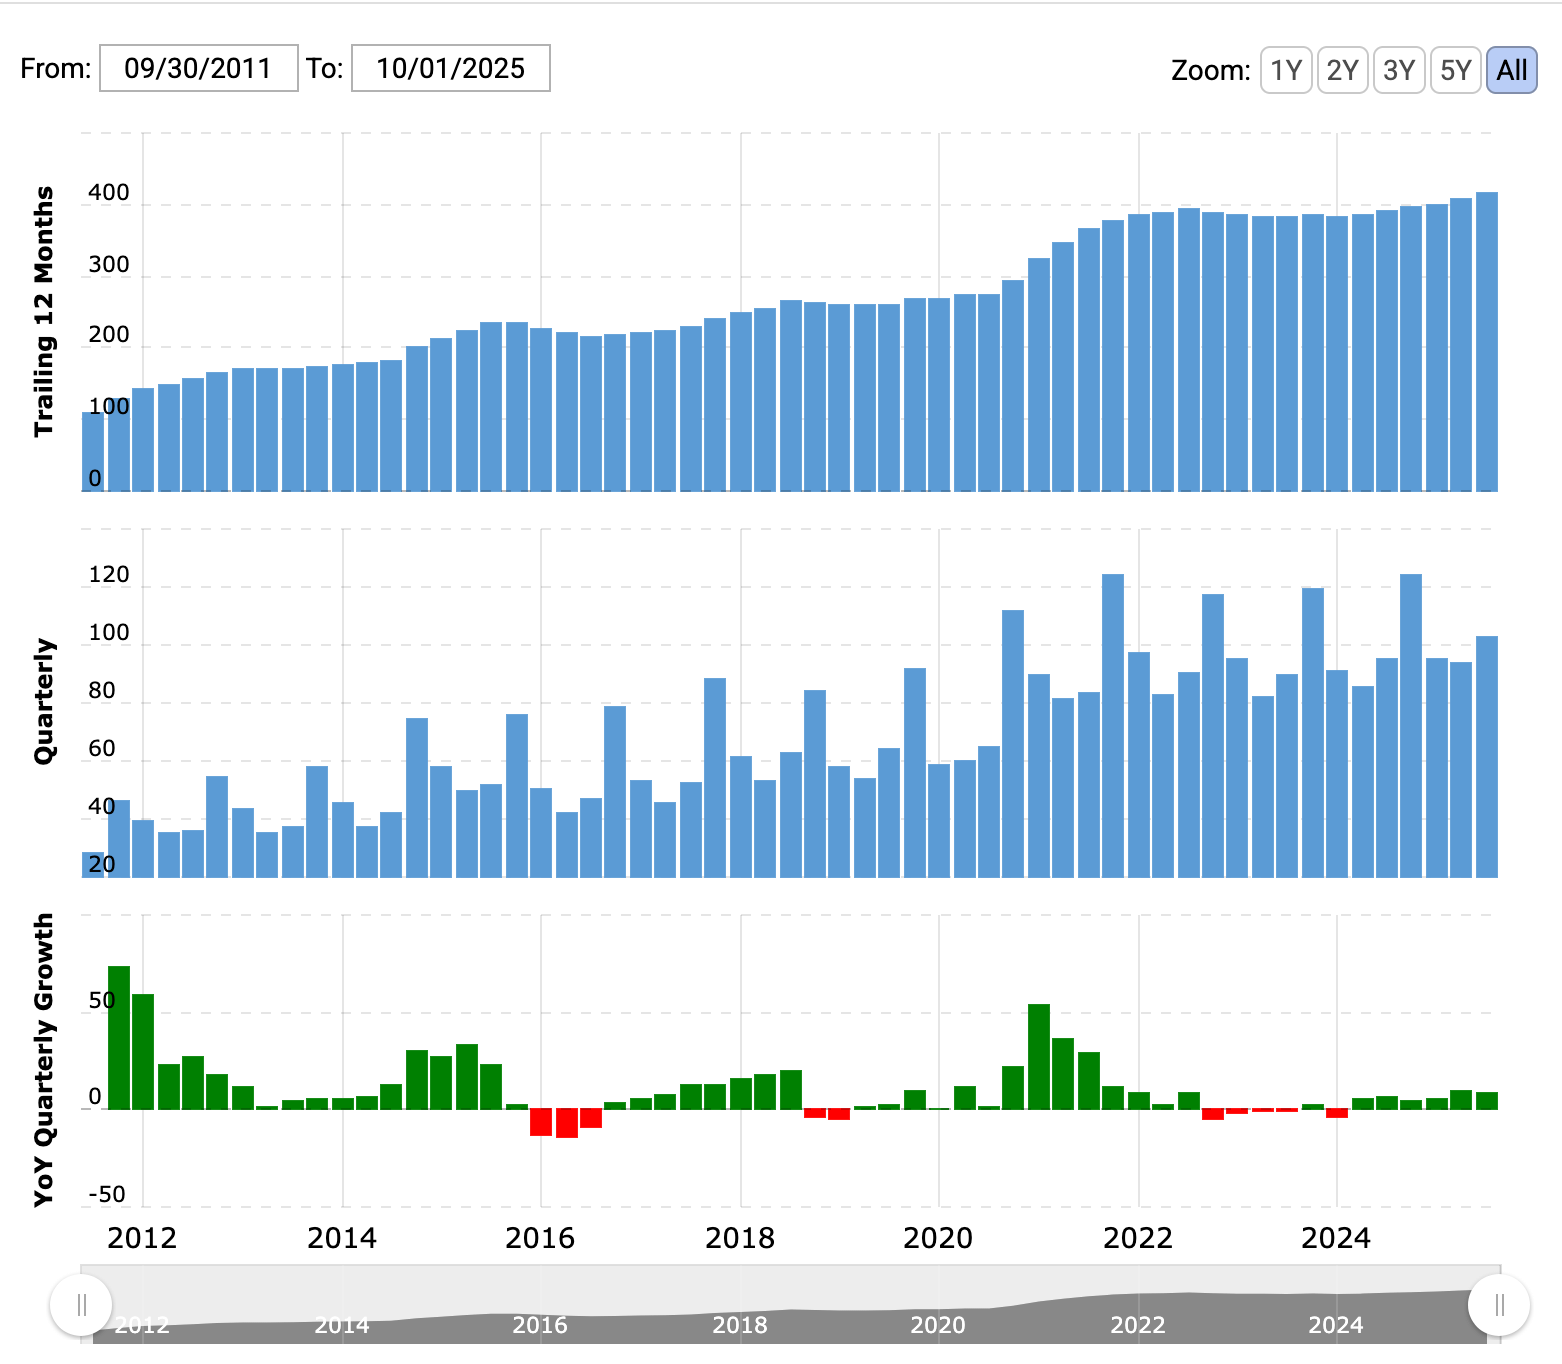
Above are the annualized and quarterly revenues of Apple for the last 14 years. Revenues grew from roughly 100 billion four fold just past 400 billion. Growth, but note the slowing speed of growth on the bottom most of the charts.
The stock price in September 2012 was around $25. Yesterday it closed at $272. There were some share buybacks in that time period, but not enough to account for the difference between 4x revenue growth and 10.8x increase in value.
Revenues don’t explain that different. Which makes sense, as the public stock market investors focus more on earnings (a.k.a. profits) than on revenues. So let’s look at earnings:
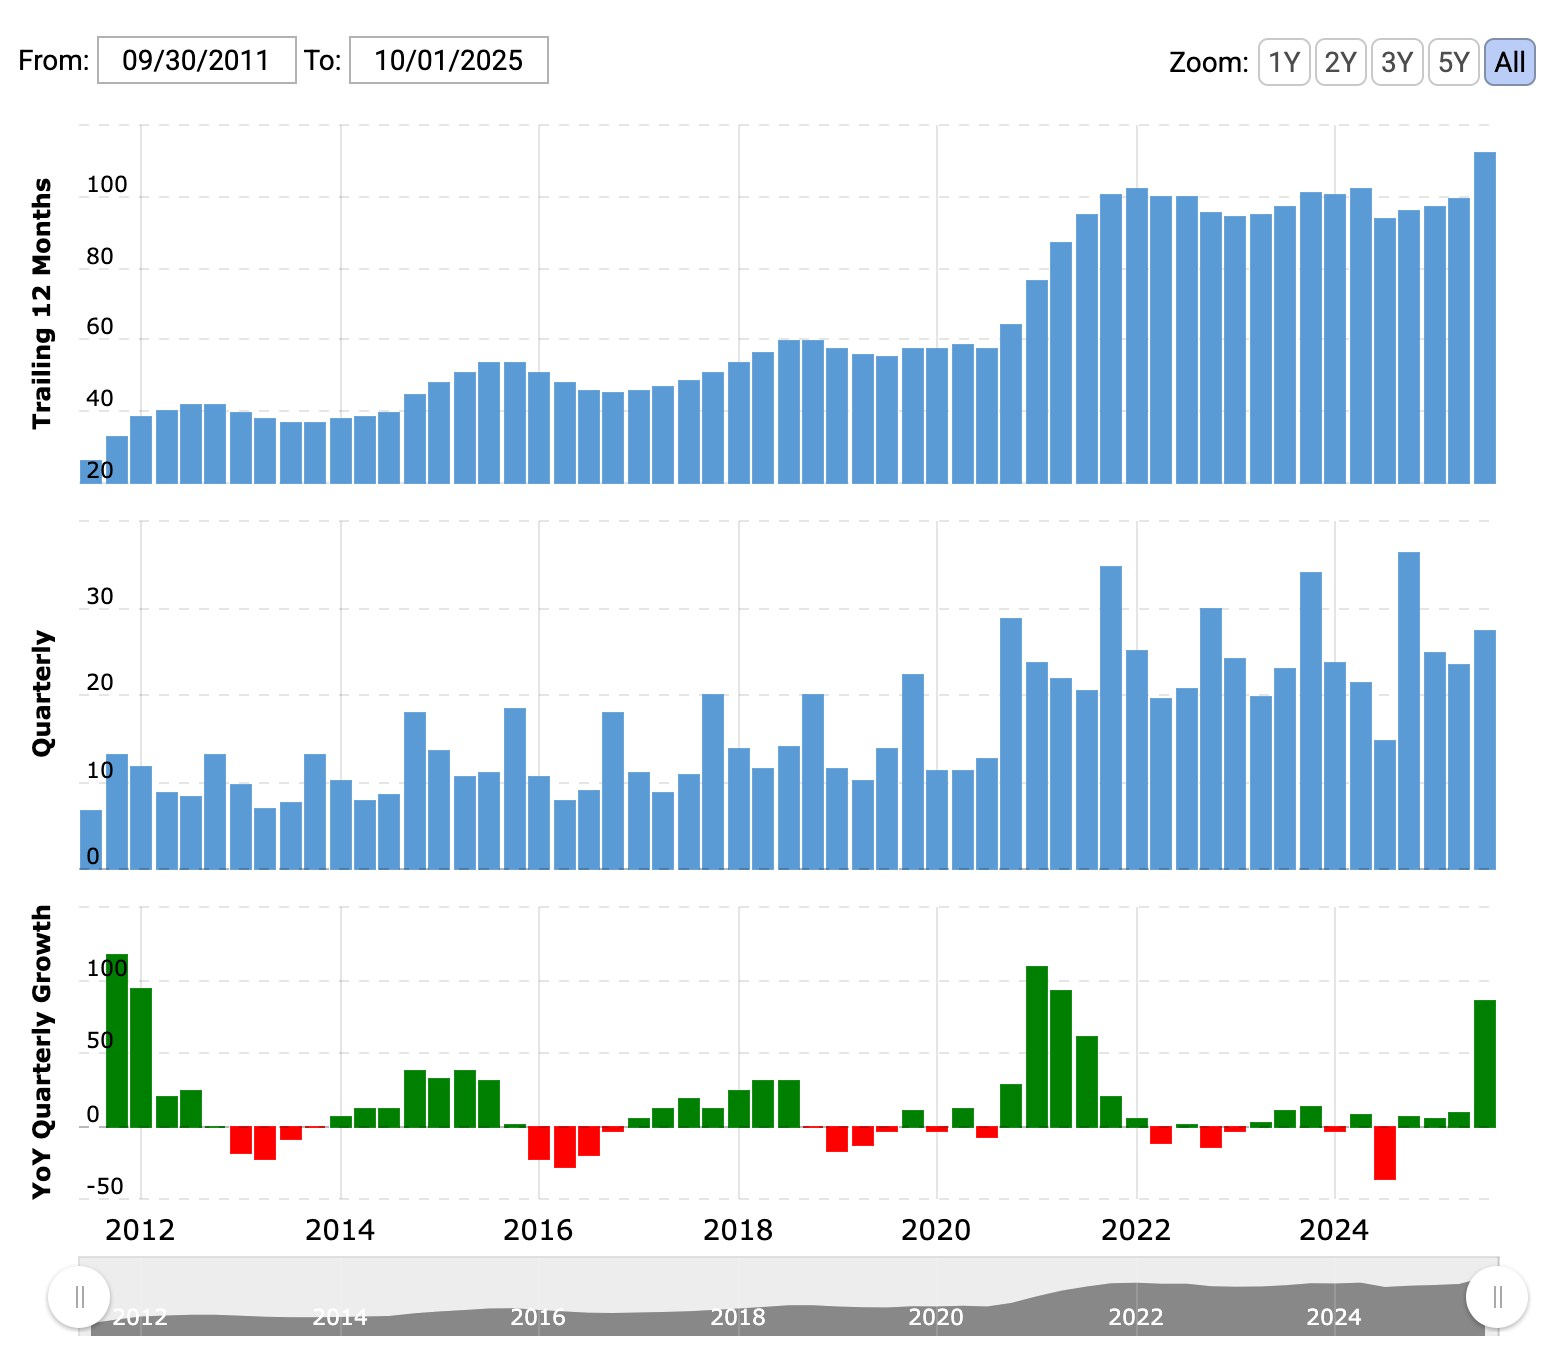
Above are the annualized and quarterly net profits (a.k.a. earnings) for the same 14 year time period. This website doesn’t have data before that to see if the roughly $25 billion at the start of the chart is anomalous, but let’s be generous and say not. And let’s also count the latest $125 billion trailing 12 month value too. That growth is then 125/25 = 5x growth. (If we drop the outliers, 100/40 = only 2.5x.)
So no, this didn’t explain the 10.8x rise in share price either.
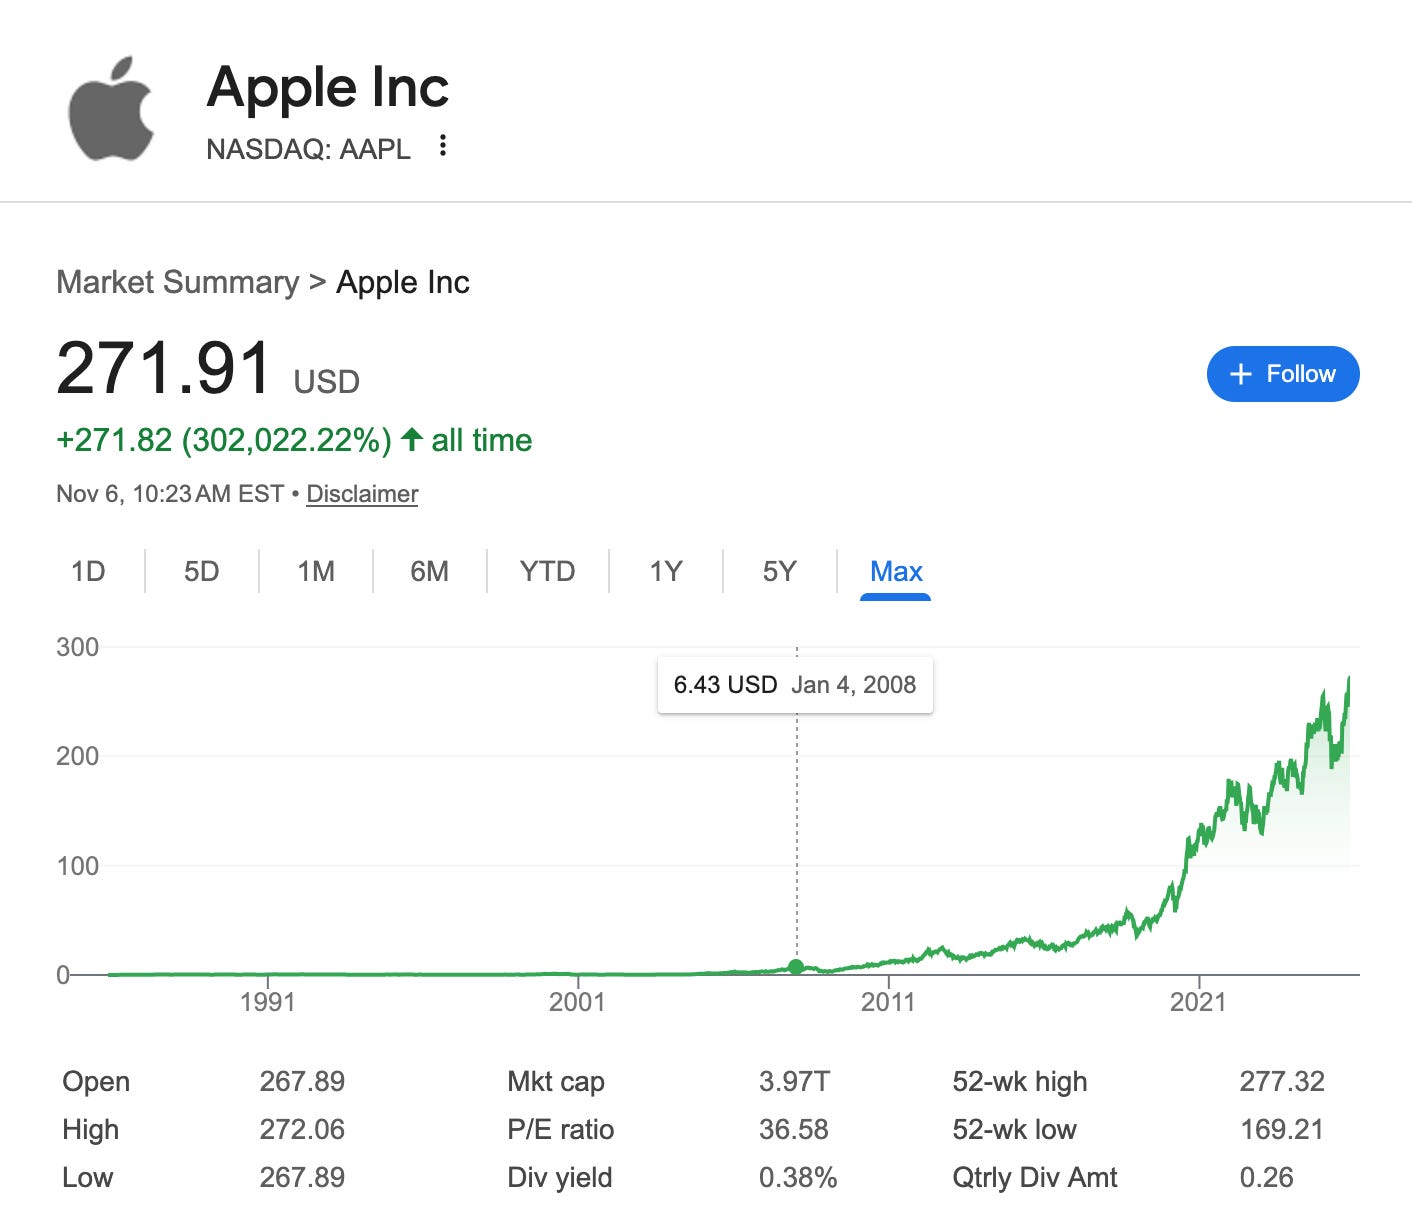
Looking at the market data, what pops out to me is the 36.58 PE ratio. The most recent investors are paying $36.58 per $1.00 of earnings. That is a historically high value. One more chart shows that growth:
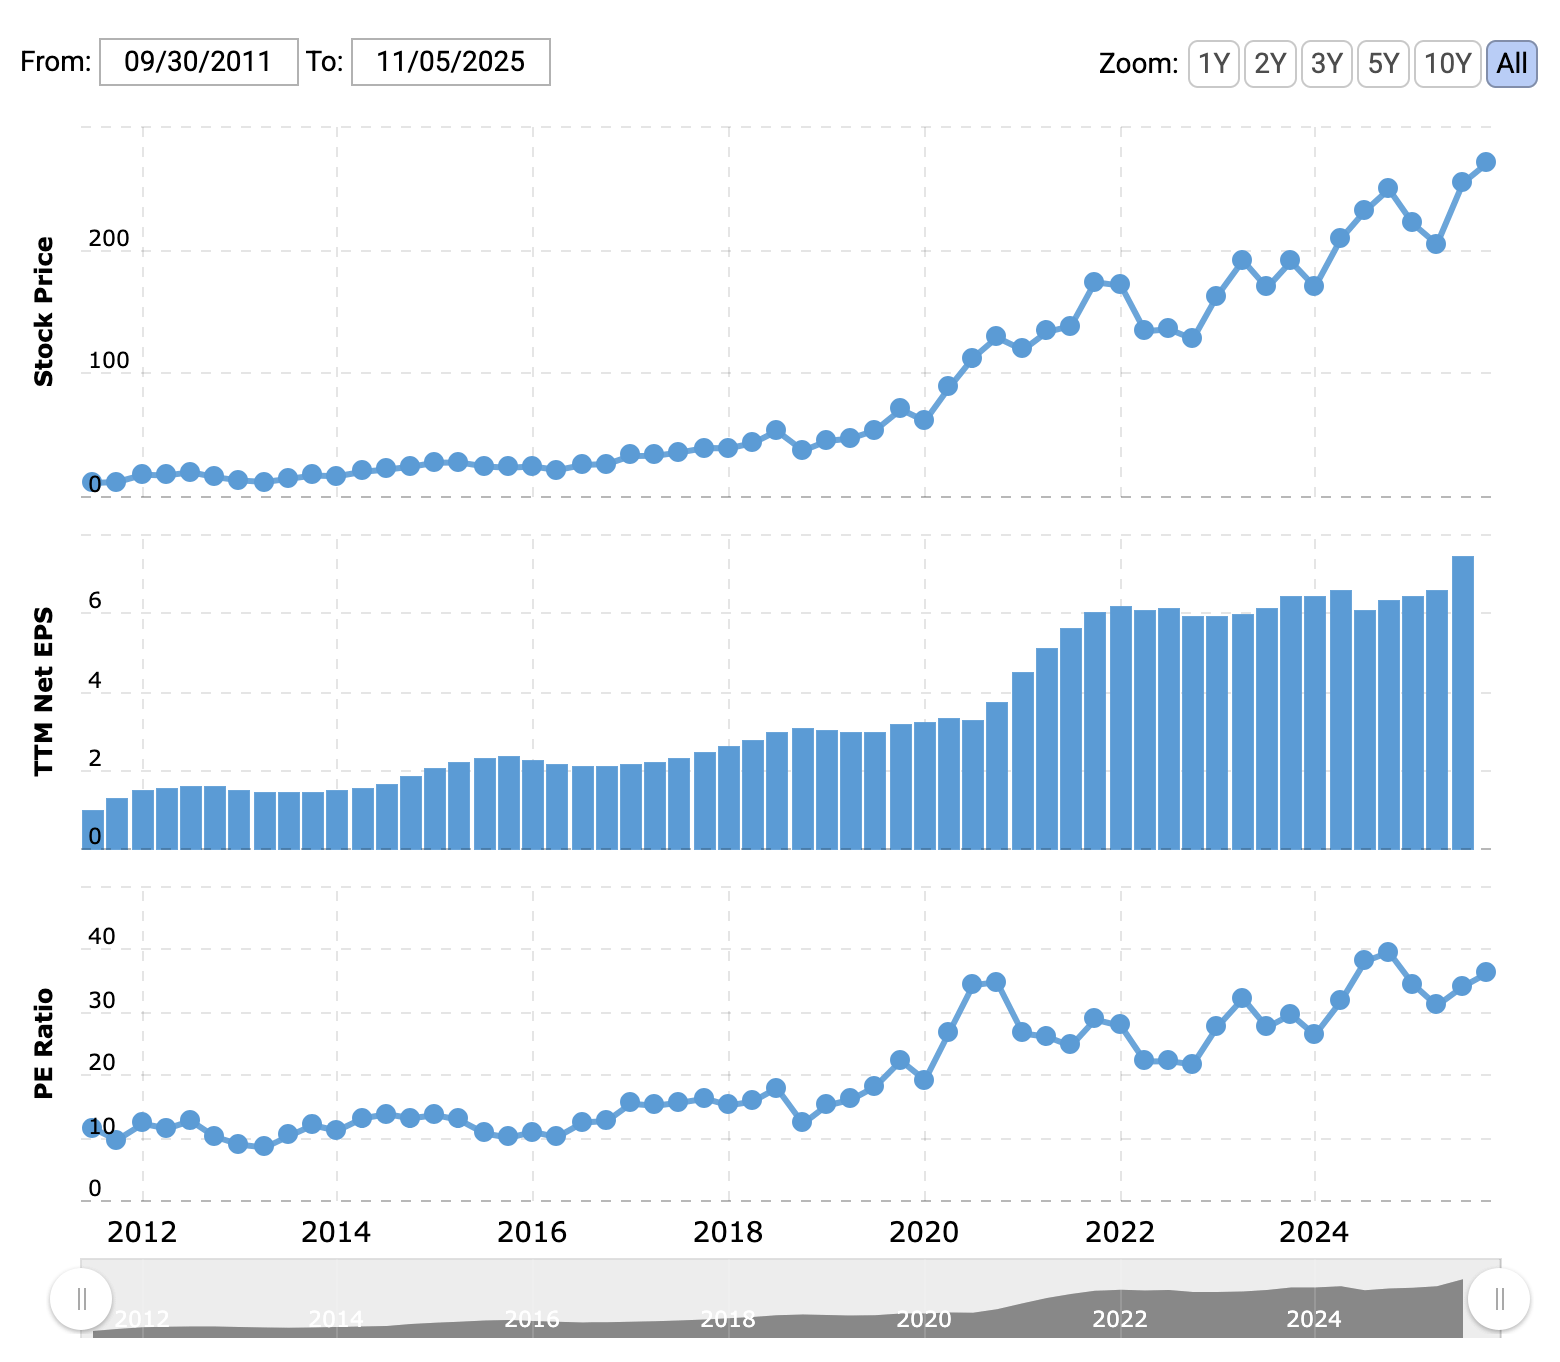
14 years ago Apple sold $1.00 of earnings for $10.00. That was below the historic US public market PE ratio of 12-15. If we divide the 10.8x share price growth by the 3.6x PE ratio growth, we are left with 3x growth that is driven by growth in revenues and profits.
So in Apple’s case, the bigger driver of “it depends” is the market, not the company.